
September 16, 2026
Board-level evidence on Ontario public school enrolment, 2018-19 to 2024-25
Summary
Recent public commentary has described Ontario’s public schools as losing students. This analysis tests that claim against the Ministry of Education’s enrolment-by-grade files for all 72 school boards and four school authorities from 2018-19 to 2024-25. The evidence supports a more qualified conclusion.
- Province-wide public school enrolment rose from 2,040,485 in 2018-19 to 2,095,195 in 2024-25, an increase of 2.7 per cent. Apart from the first pandemic school year, enrolment has risen in every year of the period, and in each of the last four.
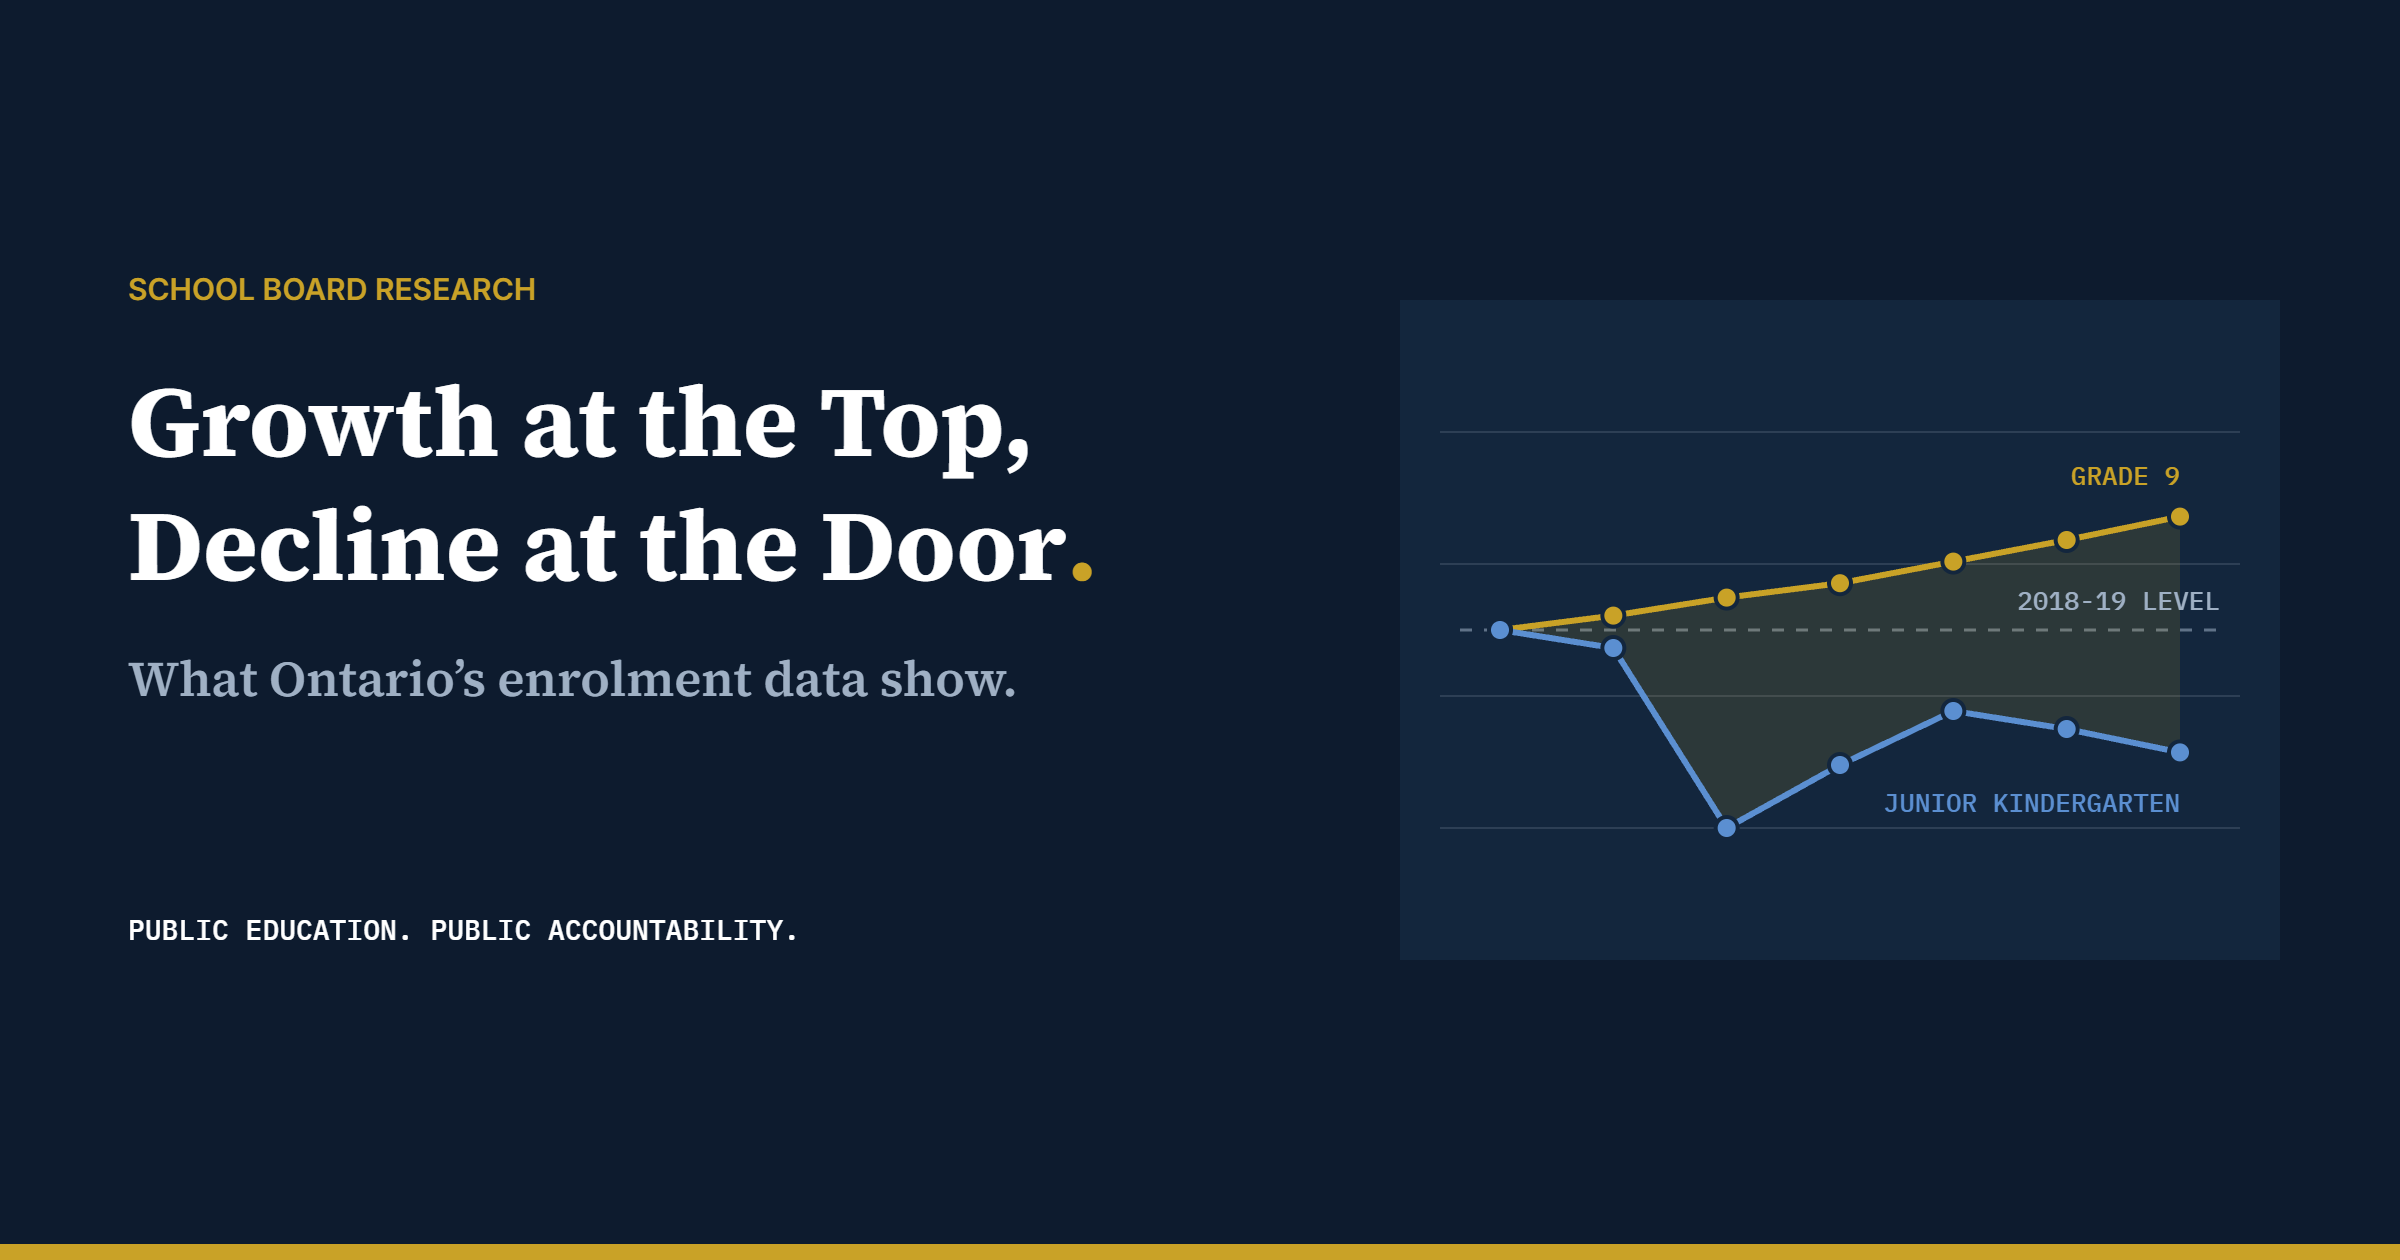
- The growth is being carried by older cohorts. Grade 9 enrolment is 6.3 per cent above its 2018-19 level, while Junior Kindergarten enrolment is 6.8 per cent below it and has not regained that level since 2020-21. This is the clearest leading indicator of future decline in the data.
- Decline is concentrated rather than general. Fifty-one of 76 boards and authorities grew over the period and 23 declined. Five Greater Toronto Area boards together account for a loss of nearly 36,000 students.
- The Fraser Institute’s finding that Ontario public enrolment fell between 2000-01 and 2023-24 is consistent with these data. The two sources agree closely for 2023-24. The difference lies in the period examined: the ministry’s longer school-level series shows the decline reaching its low point in 2015-16, after which enrolment rose by 101,785 students. By 2024-25 it exceeded its 2011-12 level.
1. Introduction
In September 2026 the Fraser Institute published the latest edition of Where Our Students Are Educated, which reports that Ontario’s public school enrolment fell by 3.0 per cent between 2000-01 and 2023-24 while independent school enrolment grew by more than half (Zwaagstra, MacPherson and Shang 2026). Earlier in the summer, CP24 reported that the Toronto District School Board expected roughly 3,000 fewer students in 2025-26 and a further 5,000 fewer the following year, and that several other GTA boards were also reporting lower enrolment (Lev 2026). These reports have fed a broader impression that the province’s public system is contracting.
Enrolment matters for more than headlines. It drives most provincial operating funding to school boards, determines the need for space, and shapes the decisions trustees will be asked to account for in the 26 October 2026 municipal and school board elections. The question this note addresses is narrow: do the ministry’s own board-level enrolment counts show a decline, and if so, where?
2. The provincial trend

Across the six years examined, total public school enrolment grew by 54,710 students (Figure 1). The only material decline came in 2020-21, the first school year of the pandemic, when enrolment fell by 1.5 per cent. Most of that year’s drop occurred in kindergarten, consistent with contemporaneous reports that families kept young children at home rather than enrol them (Global News 2021). Enrolment returned above its 2018-19 level in 2022-23 and grew in each of the following two years. Secondary enrolment rose by 6.1 per cent over the period and elementary enrolment by 1.2 per cent.
Growth was recorded in each of the four publicly funded systems (Table 1). French-language public boards grew fastest in proportional terms, followed by English Catholic boards.
Table 1. Public school enrolment by system, 2018-19 and 2024-25
| System | Boards | 2018-19 | 2024-25 | Change | Boards that grew / declined |
|---|---|---|---|---|---|
| English public | 31 | 1,357,645 | 1,388,090 | +2.2% | 23 / 7 |
| English Catholic | 29 | 570,740 | 591,315 | +3.6% | 22 / 7 |
| French public | 4 | 33,280 | 36,520 | +9.7% | 3 / 1 |
| French Catholic | 8 | 77,740 | 78,270 | +0.7% | 2 / 6 |
| School authorities | 4 | 1,080 | 1,000 | −7.4% | 1 / 2 |
| Total | 76 | 2,040,485 | 2,095,195 | +2.7% | 51 / 23 |
Source: Ontario Ministry of Education, enrolment by grade in elementary and secondary schools. Two bodies recorded no change. Analysis: School Board Research.
3. A shrinking entry cohort

The aggregate figures conceal a divergence between the entry grades of the elementary and secondary panels (Figure 2). Grade 9 enrolment rose from 146,825 in 2018-19 to 156,125 in 2024-25. Junior Kindergarten enrolment moved in the opposite direction, from 129,135 to 120,335. JK intake fell sharply in 2020-21, partly recovered by 2022-23, and has declined again in each year since.
Because each entering class moves through the system one grade at a time, a smaller JK intake is a leading indicator. If intake remains at its current level, elementary enrolment can be expected to fall across the province over the coming decade, and secondary enrolment to follow. The current provincial growth reflects the passage of larger cohorts through the upper grades and is unlikely to persist on its own.
4. Where the decline is occurring

The provincial total masks wide variation between boards (Figure 3). The five largest declines in absolute terms were all in the Greater Toronto Area: Peel DSB (−10,440 students, −6.6 per cent), Dufferin-Peel Catholic DSB (−9,575, −11.9 per cent), Toronto DSB (−7,810, −3.2 per cent), Toronto Catholic DSB (−4,500, −4.9 per cent) and York Catholic DSB (−3,650, −6.9 per cent). Together these boards lost 35,975 students.
Northern boards recorded smaller absolute losses but steeper proportional ones, including the Conseil scolaire catholique du Nouvel-Ontario (−17.2 per cent), Kenora Catholic DSB (−11.0 per cent), Thunder Bay Catholic DSB (−10.8 per cent) and Rainy River DSB (−9.8 per cent). Six of the eight French-language Catholic boards declined, including Providence and MonAvenir in southern Ontario.
The five largest proportional gains were all in Catholic boards: London District Catholic School Board (+31.4 per cent), Brant Haldimand Norfolk Catholic DSB (+23.9 per cent), Nipissing-Parry Sound Catholic DSB (+21.9 per cent), Waterloo Catholic DSB (+21.0 per cent) and Ottawa Catholic School Board (+17.7 per cent). In absolute terms, Durham DSB added the most students (+8,915).
Decline is also becoming more widespread. Between 2023-24 and 2024-25, 31 boards and authorities lost students, even as provincial enrolment rose by 14,705.
5. Reconciling these findings with the Fraser Institute

The Fraser Institute’s Ontario figures and ours draw on the same underlying ministry data; the report cites the province’s Ontario Public Schools Enrolment dataset as its source. They agree closely. For 2023-24, Fraser reports total public enrolment of 2,080,090; the board files sum to 2,080,490, a difference of 400 students. The totals for each of the four systems agree to within 700.
The apparent contradiction is therefore one of period, not of evidence. Fraser’s Table 4 records public enrolment of 2,143,599 in 2000-01, a fall of 63,509 students (3.0 per cent) to 2023-24 (Zwaagstra, MacPherson and Shang 2026, 14). The ministry’s school-level enrolment series, which begins in 2011-12, shows when that decline occurred (Figure 4). Enrolment stood at 2,042,995 in 2011-12, fell in each of the next four years to a low of 1,993,330 in 2015-16, and has risen in every year since except the first pandemic year. By 2024-25 it had reached 2,095,115, an increase of 101,785 from the low point and above its 2011-12 level. On these figures, roughly two-thirds of the fall from 2000-01 to 2015-16 has been recovered. That estimate joins a Fraser figure for 2000-01 to the ministry series and should be read as approximate, although the two sources differ by only 215 students in 2023-24.
The report’s principal finding concerns share rather than headcount. The public share of Ontario students fell from 95.1 per cent to 92.0 per cent over the 23 years, while independent school enrolment rose from 109,904 to 167,802, an increase of 52.7 per cent (Zwaagstra, MacPherson and Shang 2026, 18). The report also records 13,131 home-schooled students in 2023-24 (ibid., 21). Board enrolment files cannot test these findings, since they count only students in publicly funded boards, and nothing in this analysis contradicts them. The report similarly notes that separate school enrolment fell by 3.1 per cent over its period (ibid., 13). In the more recent window examined here, combined Catholic enrolment rose from 648,480 to 669,585.
6. Implications
Most Core Education Funding allocations are calculated by multiplying a board’s average daily enrolment by per-pupil benchmarks, and the province provides a separate Declining Enrolment Adjustment for boards losing students (Ontario Ministry of Education 2026). Enrolment trends therefore translate quickly into financial pressure. For the declining GTA boards, that pressure is already visible in staffing and program reductions. For the growing boards, the corresponding pressure is on space.
The entry-cohort data suggest that the boards now growing should not assume that growth will continue.
School Board Research’s Board Report Card, covering all 72 boards, is available at schoolboardresearch.ca/board-report-card/.
7. Data, method and limitations
The analysis uses the Ministry of Education’s open datasets Enrolment by Grade in Elementary Schools and Enrolment by Grade in Secondary Schools for each school year from 2018-19 to 2024-25. Board rows were summed and matched across years by board number. Systems were assigned from board names. Figure 4 uses the ministry’s school-level dataset, Ontario Public Schools Enrolment, for 2011-12 to 2024-25; school rows were summed, and the small number of cells published as fewer than 10 were counted as zero. In the years both series cover, the school-level and board-level totals differ by at most a few hundred students. The ministry rounds counts to the nearest five; counts are headcounts rather than full-time equivalents; and Grade 12 includes students in a fifth year of secondary school. Figures for 2025-26 have not yet been published, so the TDSB decline reported for the current year is not reflected here.
References
Global News. 2021. “Educator urges parents to enrol their children in kindergarten.” 23 March. https://globalnews.ca/news/7705132/educators-children-kindergarten/
Lev, Elianna. 2026. “Public school enrollment on the decline in some boards. What is causing it?” CP24, 18 July. https://www.cp24.com/local/toronto/2026/07/18/if-the-gta-population-is-up-why-are-public-school-numbers-down/
Ontario Ministry of Education. 2019-2025. Enrolment by Grade in Elementary Schools, 2018-19 to 2024-25. Ontario Data Catalogue. https://data.ontario.ca/dataset/enrolment-by-grade-in-elementary-schools
Ontario Ministry of Education. 2019-2025. Enrolment by Grade in Secondary Schools, 2018-19 to 2024-25. Ontario Data Catalogue. https://data.ontario.ca/dataset/enrolment-by-grade-in-secondary-schools
Ontario Ministry of Education. 2012-2025. Ontario Public Schools Enrolment, 2011-12 to 2024-25. Ontario Data Catalogue. https://data.ontario.ca/dataset/ontario-public-schools-enrolment
Ontario Ministry of Education. 2026. Core Education Funding: Technical Guide for School Boards, 2026-27. Spring 2026. https://www.ontario.ca/files/2026-05/edu-tech-guide-2026-27-en-2026-05-08.pdf
Ontario Public School Boards’ Association. 2026. “2026 Municipal and School Board Elections.” https://www.opsba.org/2026-municipal-and-school-board-elections/
Zwaagstra, Michael, Paige MacPherson and Max Shang. 2026. Where Our Students Are Educated: Measuring Student Enrolment in Canada, 2026. Fraser Institute. https://www.fraserinstitute.org/studies/where-our-students-are-educated-measuring-student-enrolment-canada-2026
Legal disclaimer. School Board Research is not a law firm, its researchers are not lawyers, and nothing in this article is legal advice. A reader who needs advice about their own situation should consult a lawyer.
School Board Research publishes independent analysis of Ontario school board data and policy. We are not lawyers, and nothing in this publication is legal advice. If you identify an error, please write to info@schoolboardresearch.ca. Corrections are noted on the page where they are made.
Leave a Reply