
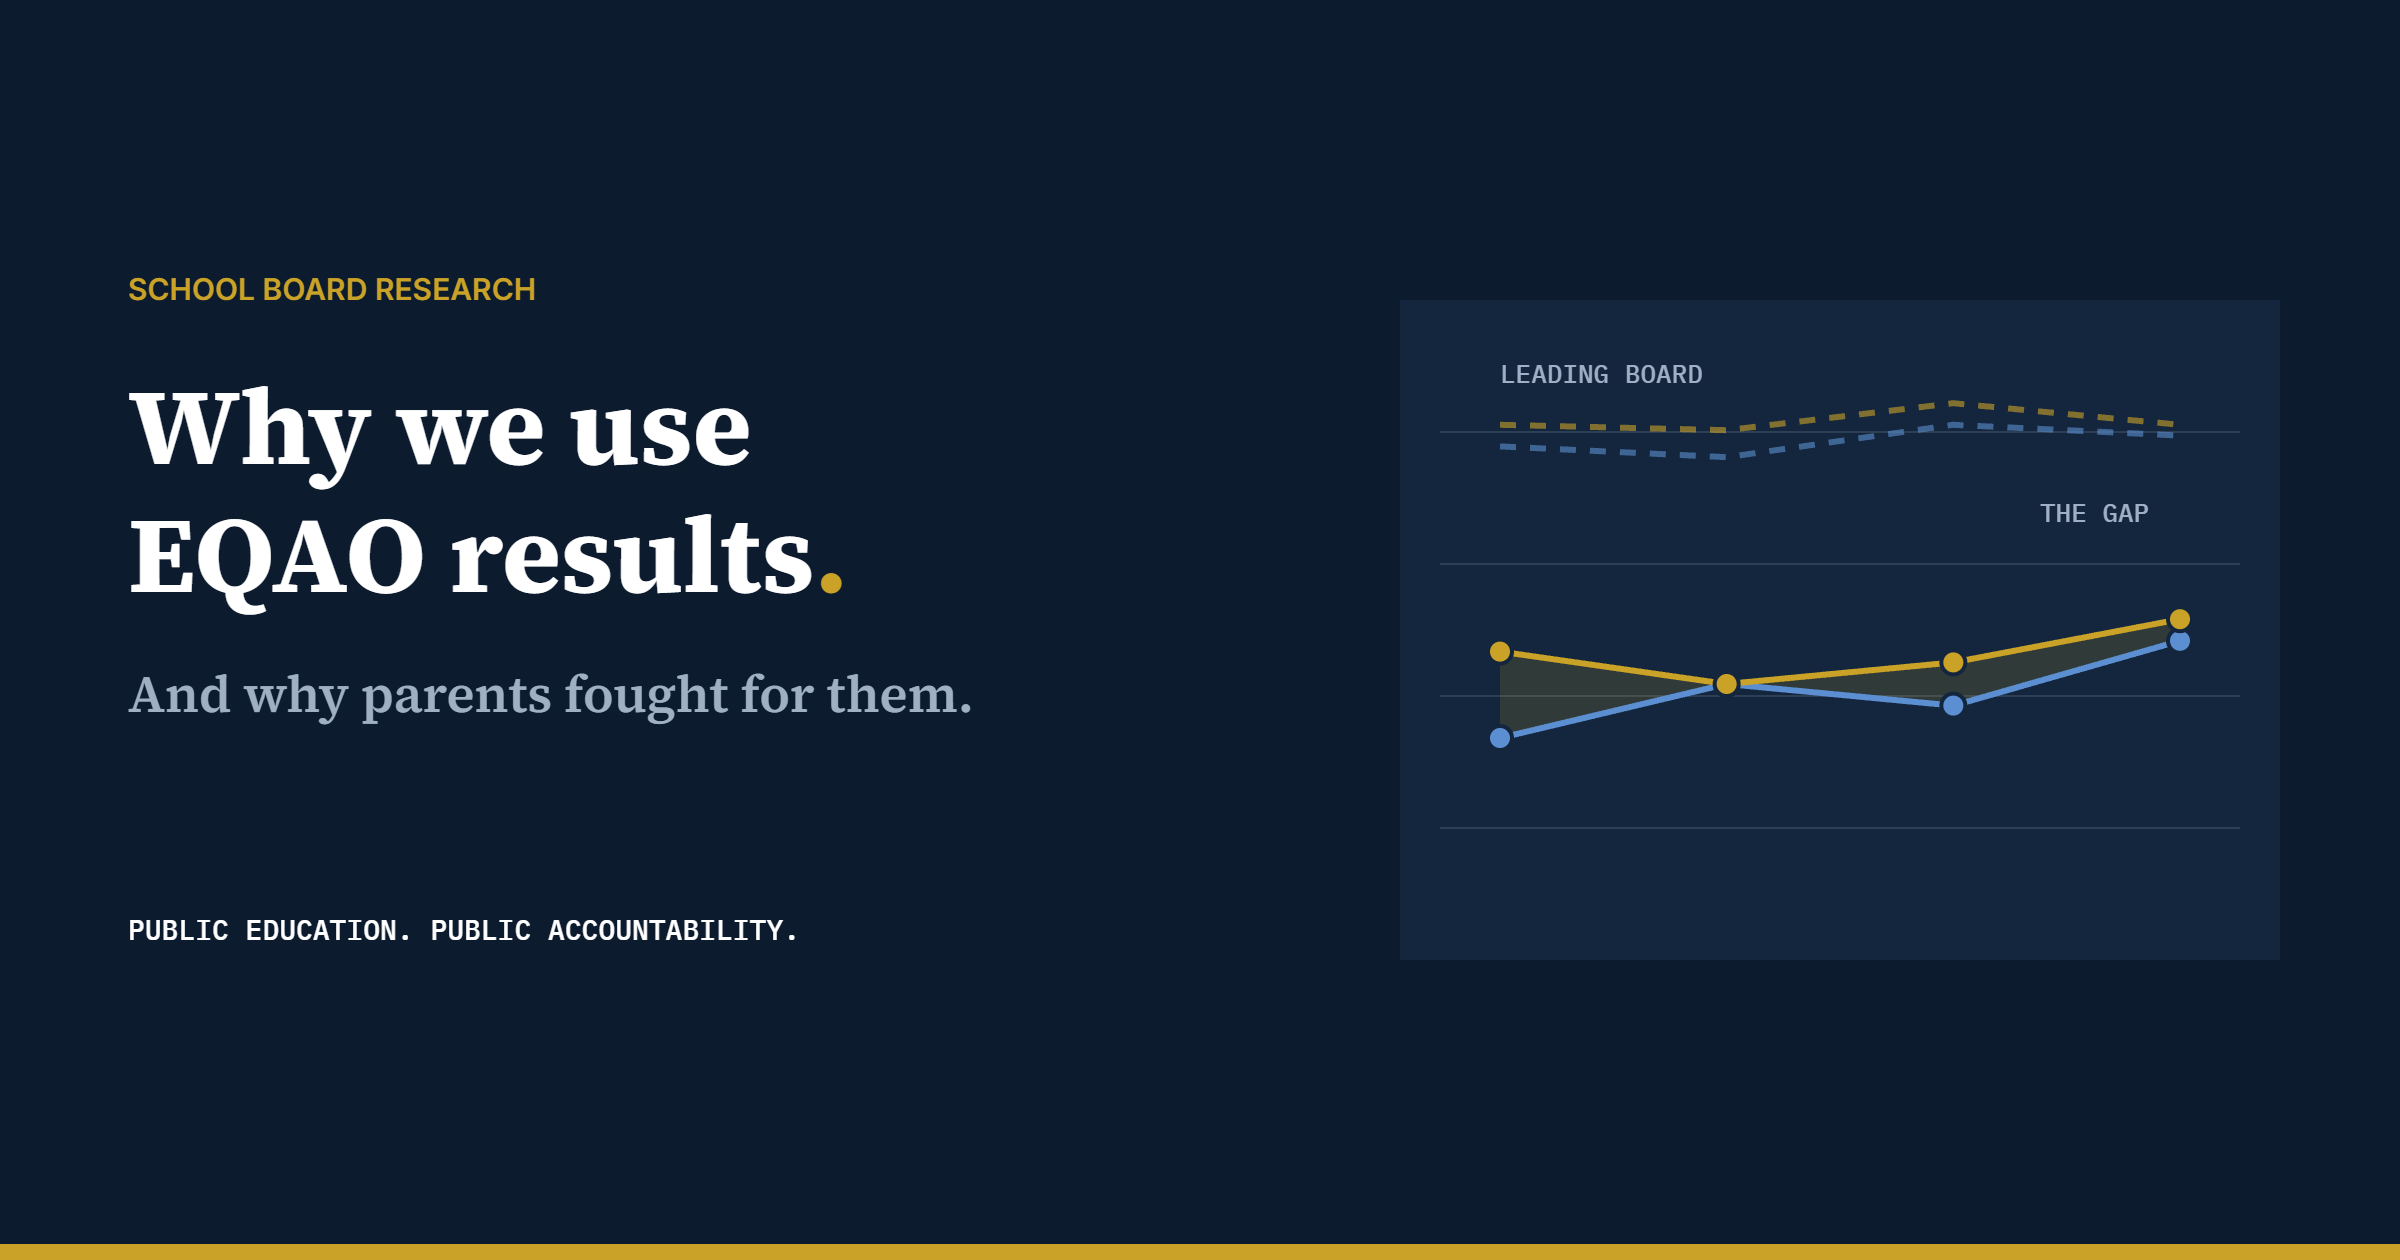
September 24, 2026
The origins, strengths and limitations of Ontario’s provincial assessments, and why they remain the only public board-level measure of student learning
Summary
The School Board Report Card uses results from the Education Quality and Accountability Office (EQAO) to compare student achievement across Ontario’s 72 district school boards. Some parents have asked whether those results are a fair basis for judging a board. This note sets out where the assessments came from, what they measure well and poorly, and why they remain the best public evidence available.
- Provincial testing in Ontario was not imposed on a willing school system. It followed years of pressure from parents who found that report cards did not reflect whether their children could read, and it was established in 1996 with all-party support.
- EQAO results are the only public, standardized and independent measure of student learning that covers every board in the same way. When the Ontario Human Rights Commission examined reading outcomes in 2019-22, it found no other data source to use.
- Board-level results reveal patterns no other public source can. At the English-language board with the lowest Grade 3 reading results in 2024-25, 48 per cent of boys and 45 per cent of girls were not at the provincial standard, compared with 15 and 12 per cent at the leading board.
- The main criticisms of EQAO, including test preparation, the influence of family income and the absence of a growth measure, are well founded. Each is an argument for publishing more and better data, not for removing the only measure that exists.
1. Introduction
Each autumn, the release of EQAO results is followed by a familiar debate. The tests are said to be too narrow, to encourage schools to teach to the test, to measure grades rather than children, and to reward boards that serve higher-income families. Several of these points have merit, and they are addressed below.
The question for parents, taxpayers and trustees is narrower. It is not whether EQAO is a complete measure of a child’s education, which it is not. It is whether any other public source allows a reader to judge, on the same basis for every board, whether children are learning to read, write and do mathematics. This note argues that none does, and that the history of provincial testing explains why the assessments exist in the first place.
2. How provincial testing began
Before the 1990s, Ontario had no large-scale provincial assessments. Parents relied on report cards and teachers’ judgments, with no independent means of knowing whether their child’s school, or their board, was doing better or worse than any other.
Paul Bennett’s history of the period places the start of Ontario’s quality-education movement with one parent (Bennett 2020, 47-49). In the early 1990s, Maureen Somers-Beebe, a mother of three near Peterborough, found that her son Adam was finishing Grade 3 with above-average grades although he, and several classmates, could barely read. She asked her board what the children were expected to learn, how and when they would learn it, and how the teacher, the parent and the child would know it had been learned. The board did not answer. Her parent group was referred to the Ministry of Education, and she was barred from one meeting with senior staff for “hostile body language” (Bennett 2020, 48). When the board tested the 21 children in Adam’s Grade 4 class, 12 were reading at about a Grade 2 level (Bennett 2020, 48; Nikiforuk 1993, 21).
Her experience was not isolated. In Waterloo, Malkin Dare found that her son Laurie could not read in Grade 2 despite strong report cards. She went on to co-found the Organization for Quality Education, a parent group that pressed for public reporting on student achievement for more than two decades (Bennett 2020).
In 1993 the provincial government launched the Royal Commission on Learning, co-chaired by Monique Bégin and Gerald Caplan, with a broad mandate to review the purpose and direction of Ontario’s schools (O’Sullivan 1999, 318). Its report, released in early 1995, recommended province-wide testing of literacy and numeracy. The Commission stated that the public school system “owes to the public to demonstrate how well it’s doing with our children” (quoted in EQAO 2013). EQAO was established in 1996 as an arm’s-length Crown agency, with all-party support. By its own account, the government “wanted to respond to the public’s demand for more accountability and clearer and better information about the quality and effectiveness of the province’s publicly funded education system” (EQAO 2013). The first Grade 3 assessment was administered in 1996-97, followed by Grade 6 in 1998-99, Grade 9 mathematics in 2000-01 and the Ontario Secondary School Literacy Test in 2002.
The question EQAO was created to answer is, in substance, the last of Somers-Beebe’s questions: how will the parent know?
3. What board-level results reveal

Figure 1 reproduces the Grade 3 section of the Report Card for the English-language board with the lowest Grade 3 reading results in 2024-25. Solid lines show the share of the board’s boys and girls at or above the provincial standard. Dashed lines show the leading board, the highest result any English-language board reached in that year.
Three patterns are visible. First, the board is improving for boys in reading, from 42 per cent at the standard in 2021-22 to 52 per cent in 2024-25, while the result for girls moved from 58 to 55 per cent. Second, the board has been more than 30 percentage points behind the leading board in reading in every year shown. Third, the gaps between boys and girls run in different directions by subject: in writing, 67 per cent of boys and 61 per cent of girls were not at the standard in 2024-25, while in mathematics the figures were 52 per cent of boys and 58 per cent of girls.
For comparison, across all English-language boards in 2024-25, 30 per cent of Grade 3 boys and 22 per cent of Grade 3 girls were not at the provincial reading standard. None of these patterns can be seen in report card marks, board improvement plans or annual reports. They can be seen only because EQAO publishes comparable results for every board.
4. Strengths of the assessments
Four features make EQAO results suited to comparing boards.
- A common standard. Every student in a tested grade writes the same assessment, scored against the same provincial standard (Level 3). Report card marks vary between teachers, schools and boards; the cases in section 2 show that they can describe a child who cannot read as above average.
- Independence. Boards administer the assessments but do not write or score them.
- Public, disaggregated reporting. Results are published for every board and school and can be reported by sex, which is how gaps between boys and girls become visible.
- Linked student records. EQAO links individual students’ Grade 3 and Grade 6 results. Those linked data showed in 2016 that only four per cent of students who missed the Grade 3 mathematics standard had reached it by Grade 6 (CBC News 2016). A child who is behind at eight is very likely to remain behind at eleven.
5. Limitations
The principal criticisms of EQAO are well founded.
- Preparation and accommodations. Sample tests are published and schools use them. Accommodations such as scribing and assistive technology can also raise results. The Human Rights Commission cited a report finding that in 2018-19 only 8.5 per cent of Grade 3 students with an Individual Education Plan met the reading standard without those supports (OHRC 2022).
- Family income. School results rise with neighbourhood income (Armstrong and Cain 2012), so raw results favour boards serving higher-income communities.
- Status rather than growth. Headline results report the share of students at the standard in a given year. EQAO does not publish a board-level measure of how much each board adds to its students’ learning over time.
- Scope and continuity. The assessments cover reading, writing and mathematics only. Some assessments were not written during the 2015 labour dispute and the 2020 school closures, and in 2025 the province delayed the release of results (Global News 2025).
Each of these limitations points toward more measurement rather than less: results reported with and without accommodations, results adjusted for student background alongside the raw figures, a published growth measure for each board, and universal early reading screening with public results, as the Human Rights Commission recommended (OHRC 2022).
6. Why EQAO remains the best available measure
When the Human Rights Commission set out to measure reading outcomes for its Right to Read inquiry, it reported that “as school boards and the province do not collect other data on reading outcomes, the main source of quantitative data for the inquiry was EQAO reading test scores” (OHRC 2022). Report card marks are not comparable across schools. Board improvement plans set out intentions rather than results. Without EQAO, the public would be left with each board’s own account of its performance.
School Board Research’s Board Report Card, covering all 72 boards, is available at schoolboardresearch.ca/board-report-card/. Parents and members of the public who wish to raise a concern about a board may do so through the public report form. School boards may request a review of a result or provide feedback through the board response form.
7. Data, method and limitations
Figure 1 and the results in section 3 are taken from the Ontario School Board Report Card, which draws on EQAO’s board-level open data for 2021-22 to 2024-25. Results are the share of fully participating students at or above the provincial standard (Level 3 or 4). The leading board is the highest result reached by any English-language board in each year. The board shown was selected as the English-language board with the lowest combined Grade 3 reading result in 2024-25, the lowest of 60. It is not named because the purpose here is to illustrate what board-level data make visible, not to single out one board; its results are available in the Report Card. The board is small, with 227 Grade 3 students with reading results in 2024-25 (127 boys and 100 girls), so changes of several points from year to year should be read with caution. Provincial comparison figures are for English-language boards and are calculated from the same dataset.
References
Armstrong, James, and Patrick Cain. 2012. “Interactive map: Data links low income to poor school test results.” Global News, 29 August. https://globalnews.ca/news/280867/interactive-map-data-links-low-income-to-poor-school-test-results/
Bennett, Paul W. 2020. The State of the System: A Reality Check on Canada’s Schools. Montreal and Kingston: McGill-Queen’s University Press.
CBC News. 2016. “Only 50% of Grade 6 students met the province’s math standard.” https://www.cbc.ca/news/canada/toronto/1.3743666
Education Quality and Accountability Office (EQAO). 2013. EQAO: Ontario’s Provincial Assessment Program, Its History and Influence, 1996-2012. Toronto: EQAO. https://www.eqao.com/wp-content/uploads/EQAO-history-influence.pdf
Education Quality and Accountability Office (EQAO). 2025. “EQAO Releases Assessment Results for 2024-2025 School Year.” 3 December. https://www.eqao.com/about-eqao/news-release/assessment-results-2025/
Global News. 2025. “Ontario delayed EQAO tests.” 21 November. https://globalnews.ca/news/11537533/ontario-delayed-eqao-tests
Nikiforuk, Andrew. 1993. School’s Out: The Catastrophe in Public Education and What We Can Do about It. Toronto: Macfarlane Walter and Ross.
Ontario Human Rights Commission (OHRC). 2022. Right to Read: Public Inquiry into Human Rights Issues Affecting Students with Reading Disabilities. https://www.ohrc.on.ca/en/right-read-inquiry-report
O’Sullivan, Brian. 1999. “Global Change and Educational Reform in Ontario and Canada.” Canadian Journal of Education 24 (3): 311-325. https://cje-rce.ca/index.php/cje-rce/article/view/2760
School Board Research. 2026. Ontario School Board Report Card. https://schoolboardresearch.ca/board-report-card/
Legal disclaimer. School Board Research is not a law firm, its researchers are not lawyers, and nothing in this article is legal advice. A reader who needs advice about their own situation should consult a lawyer.
School Board Research publishes independent analysis of Ontario school board data and policy. We are not lawyers, and nothing in this publication is legal advice. If you identify an error, please write to info@schoolboardresearch.ca. Corrections are noted on the page where they are made.
Leave a Reply